Last updated: 13 November 2026
- Live data analyst openings
- The 5 skills that get you hired
- Salary for freshers and juniors
- 5 portfolio projects to build
- Resume bullets you can adapt
- 10 interview questions with answers
- A 60-day plan
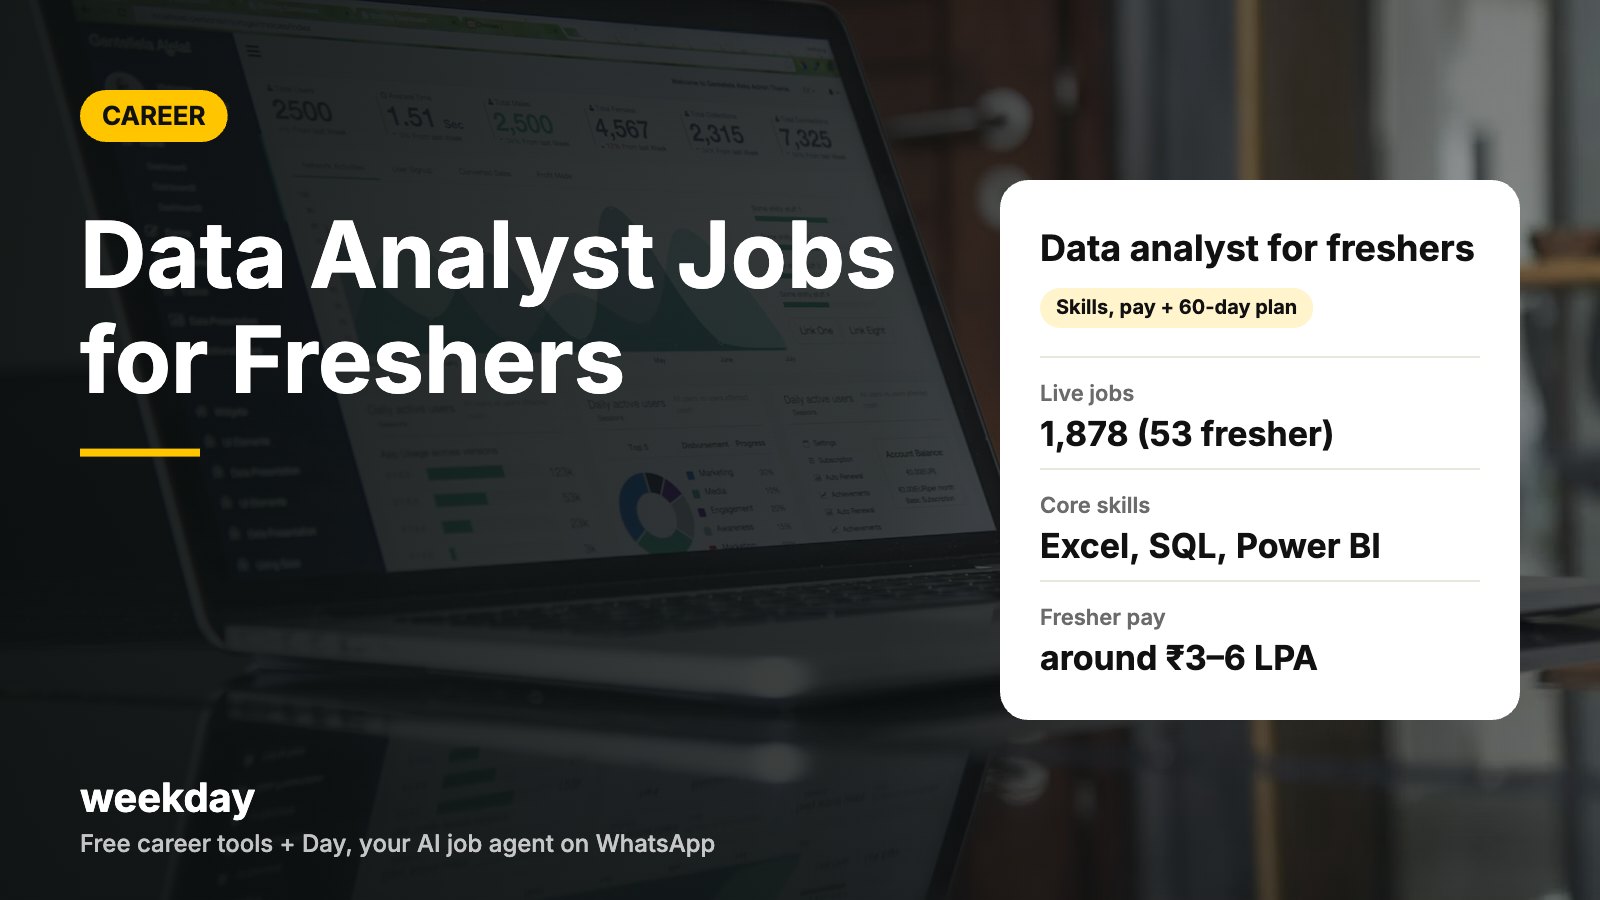
- Data analyst jobs: 1,878 live, 443 new this week (browse data analyst jobs).
- Data analyst fresher jobs: 53 live, 10 new this week (see them).
- Remote data analyst fresher jobs: 48 live, 7 new this week (see them).
- Remote Power BI jobs: 255 live, 45 new this week (see them).
Sources: Weekday job listings (jobs.weekday.works), counts as of 13 November 2026. "New this week" = jobs first posted in the last 7 days.
- Open ChatGPT and go to Plugins.
- Search Weekday Jobs and tap Try in chat (or open Weekday Jobs in ChatGPT).
- Ask in plain words, for example:
- “Find data analyst jobs for freshers posted this week”
- “Show junior data analyst jobs asking for 0–2 years with SQL and Power BI”
- “Find remote data analyst jobs for freshers with pay above ₹4 LPA”
Day, Weekday's free AI job agent, finds jobs that match your skills and pay, and applies when you say yes. On WhatsApp.
Say hi to Day on WhatsAppHow Day works →What the live numbers tell you
| Metric | Value | Working |
|---|---|---|
| Data analyst jobs, live | 1,878 | All experience levels |
| New this week | 443 | 23.6% of live (443 ÷ 1,878) |
| Tagged for freshers | 53 | 2.8% of data analyst jobs, about 1 in 35 |
| Fresher jobs that are remote | 48 | 90.6% of fresher DA jobs (48 ÷ 53) |
| Remote Power BI jobs | 255 | 17.6% new this week (45 ÷ 255) |
The big takeaway: only about 1 in 35 data analyst listings says "fresher". But many "junior" or "0–2 years" roles take strong freshers. Searching only "fresher" shows you 53 jobs; searching "junior data analyst" and 0–2 years opens up far more. The market is also active: 23.6% of data analyst jobs were posted this week.
What a junior data analyst actually does
Before you prepare, know the job. Most junior data analyst roles in India are less about machine learning and more about clean data, correct numbers and clear reports. Here is how common job description lines translate into daily work.
| The job description says | What it usually means day to day |
|---|---|
| Prepare MIS reports and dashboards | Update weekly Excel or Power BI reports for sales, ops or finance teams |
| Extract data using SQL | Write queries to pull orders, users or tickets from a database |
| Ensure data accuracy | Find duplicates, missing values and mismatches before anyone sees the numbers |
| Generate insights for stakeholders | Explain what changed this week and why, in 3–5 bullet points |
| Ad-hoc analysis | Answer one-off questions from managers, often the same day |
If a listing asks for machine learning, deep learning or 3+ years, it is usually a data scientist or senior role. Skip it for now and focus on the reporting-heavy roles above.
The 5 skills that get you hired
| Skill | What you need to know | Level for a fresher | Free way to learn |
|---|---|---|---|
| Excel | VLOOKUP/XLOOKUP, pivot tables, IF, SUMIFS, charts, data cleaning | Must have, strong | Practise on any public dataset |
| SQL | SELECT, WHERE, GROUP BY, JOINs, subqueries, window functions basics | Must have | Free SQL practice sites, sample databases |
| Power BI or Tableau | Import data, build a dashboard, basic DAX or calculated fields | One of the two | Microsoft Learn / Tableau Public |
| Python (pandas) | Read CSV, clean, groupby, merge, simple charts | Nice to have | Free notebooks with Kaggle datasets |
| Statistics | Mean, median, variance, percentiles, correlation, A/B test basics | Basics | Any intro stats course |
Order matters. Learn Excel and SQL first; they show up in nearly every junior data analyst job description. Then pick one BI tool. Python comes after, unless the role asks for it.
Data analyst salary for freshers
These are typical India ranges and vary by company, city and skills. See our full data analyst salary in India 2026 guide for more detail.
| Level | Usual annual CTC | Rough monthly in-hand |
|---|---|---|
| Fresher / intern-to-hire | around ₹3–4.5 LPA | around ₹22,000–₹33,000 |
| Junior (strong fresher, 0–2 yrs) | around ₹4.5–7 LPA | around ₹33,000–₹50,000 |
| Data analyst (2–4 yrs) | around ₹7–12 LPA | around ₹50,000–₹85,000 |
| Senior analyst (5+ yrs) | around ₹12–20 LPA | varies |
Worked example: a ₹5 LPA offer is about ₹41,667 a month before deductions. After employee PF (12% of basic) and any tax, in-hand often lands near ₹36,000–₹39,000, depending on the salary structure. Check your exact number with the in-hand salary calculator.
5 portfolio projects to build
Projects are how a fresher proves skill. Put each one on GitHub or a simple site (our developer portfolio guide shows how), with a short write-up: question, data, method, result.
| # | Project | Tools | What it proves |
|---|---|---|---|
| 1 | Sales dashboard: monthly revenue, top products, region trends | Excel or Power BI | Cleaning, pivots, dashboard design |
| 2 | E-commerce SQL analysis: repeat customers, basket size, churn | SQL | JOINs, GROUP BY, window functions |
| 3 | HR attrition analysis: who leaves and why | Python (pandas) + charts | Cleaning, grouping, storytelling |
| 4 | A/B test readout: did a new page improve sign-ups? | Excel or Python | Statistics basics, a clear recommendation |
| 5 | Public data story: e.g. city air quality or rainfall trends | Tableau Public or Power BI | Finding data, visual storytelling |
Sample project write-up (keep it this short)
Question: Which products drive repeat purchases?
Data: 50,000 orders, 12 months (public e-commerce dataset)
Method: SQL to find customers with 2+ orders; grouped by first product bought
Result: Customers whose first order was a kitchen product were 1.8x more likely to buy again
Recommendation: Feature kitchen products in first-order offers
Resume bullets you can adapt
Each bullet should name the tool, the task and a number. Copy the pattern, not the numbers.
Sample fresher data analyst resume bullets
• Built a Power BI dashboard tracking ₹2.4 Cr in sales across 4 regions; cut monthly reporting time from 6 hours to 1
• Wrote SQL queries (JOINs, window functions) on a 50,000-row orders dataset to find repeat-customer drivers
• Cleaned and merged 3 HR files (8,000 rows) in pandas; found that attrition was 2x higher in the first 6 months
• Designed an A/B test readout in Excel; recommended the new page after a 12% lift in sign-ups
• Completed Google Data Analytics certificate (2026)
For the overall layout, use our resume for freshers guide and check your ATS score with the Resume Checker.
10 interview questions with sample answers
Technical questions (SQL and Excel)
Q1. What's the difference between WHERE and HAVING?
A: WHERE filters rows before grouping; HAVING filters groups after GROUP BY. For example, WHERE city = 'Pune' filters orders first; HAVING COUNT(*) > 5 keeps only customers with more than 5 orders.

Q2. Explain the types of JOINs.
A: INNER JOIN keeps matching rows in both tables. LEFT JOIN keeps all rows from the left table plus matches. RIGHT JOIN is the reverse. FULL OUTER JOIN keeps everything from both. I use LEFT JOIN most, for example customers with or without orders.

Q3. How do you find the second-highest salary?
A: SELECT MAX(salary) FROM employees WHERE salary < (SELECT MAX(salary) FROM employees); or use DENSE_RANK() and pick rank 2.

Q4. VLOOKUP vs XLOOKUP?
A: VLOOKUP only looks right and breaks if columns move. XLOOKUP looks in any direction, has a built-in 'not found' value and is easier to read. I use XLOOKUP when it's available.

Q5. How do you handle missing data?
A: First I check why it's missing. Then I either remove rows if few are affected, fill with a sensible value like the median, or flag them. I always note what I did so results can be checked.
Statistics, project and HR questions
Q6. Mean vs median: when do you use which?
A: Median when data is skewed, like salaries, because a few very high values pull the mean up. Mean when the data is roughly symmetric.

Q7. What is a p-value, simply?
A: It's the chance of seeing a result at least this extreme if there were really no effect. A small p-value, often below 0.05, suggests the effect is probably real.

Q8. Walk me through a project.
A: In my e-commerce project, I wanted to know what drives repeat purchases. I used SQL on 50,000 orders, grouped customers by first product and found kitchen buyers were 1.8x more likely to return. I recommended featuring kitchen products in first-order offers.

Q9. How would you explain a dashboard to a non-technical manager?
A: I start with the one number that matters, say what changed and why, and end with one action. I avoid jargon and keep it to three charts.

Q10. Why data analysis, as a fresher?
A: I like turning messy data into a clear decision. In college I built a sales dashboard for a family shop that showed which items to restock weekly. I want to do that at scale.
Practise with questions from a real job description using the Interview Question Predictor.
A 60-day plan to your first data analyst job
| Days | Focus | Output |
|---|---|---|
| 1–10 | Excel: lookups, pivots, charts, cleaning | Project 1 (sales dashboard) in Excel |
| 11–25 | SQL: basics to JOINs and window functions | Project 2 (e-commerce SQL analysis) on GitHub |
| 26–35 | Power BI or Tableau | Project 1 rebuilt as an interactive dashboard |
| 36–45 | Python basics + statistics | Project 3 or 4 with a short write-up |
| 46–50 | Resume, LinkedIn, portfolio page | 1-page resume with project bullets |
| 51–60 | Apply 8–10 a day + mock interviews | 80+ applications, interview practice done |
In the last 10 days, apply to jobs posted that week, including "junior" and "0–2 years" roles. If you want help with volume, Weekday's AI job agent can shortlist data roles and apply when you say yes.
Common mistakes, and fixes
| Mistake | Fix |
|---|---|
| Learning Python first, skipping SQL | SQL and Excel first; they're in most junior JDs |
| 10 certificates, no projects | 2–3 projects with clear results beat certificates |
| Searching only "fresher" | Also search "junior" and 0–2 years (only 53 of 1,878 are tagged fresher) |
| Paying for a 'guaranteed placement' | Never pay to get a job |
FAQs
Can a fresher get a data analyst job in India?
Yes. Many companies hire freshers as junior data analysts if they show Excel, SQL, one BI tool and 2–3 projects. On 13 November 2026, Weekday listed 53 data analyst fresher jobs, and many more junior roles.
How many data analyst jobs are open right now?
1,878 live data analyst jobs on Weekday on 13 November 2026, with 443 new this week.
Are data analyst fresher jobs remote?
Mostly. 48 of the 53 data analyst fresher jobs on Weekday (90.6%) are remote.
What is the salary of a fresher data analyst in India?
Usually around ₹3–4.5 LPA, and around ₹4.5–7 LPA for strong freshers in junior roles. These are indicative ranges.
Which skills are required for a data analyst fresher?
Excel, SQL, Power BI or Tableau, basic statistics, and ideally some Python (pandas).
Is coding required for a data analyst?
SQL is required in most roles. Python helps but many junior roles hire on Excel, SQL and a BI tool.
How long does it take to become a data analyst?
With focused daily study, about 2–3 months to be job-ready for junior roles, as in the 60-day plan above.
Do I need a degree in computer science?
No. Graduates from BCom, BSc, BA, BBA and engineering all get data analyst jobs. Skills and projects matter more.
What projects should a fresher data analyst build?
A sales dashboard, an SQL analysis, an HR attrition analysis, an A/B test readout and a public data story.
Can I search data analyst jobs inside ChatGPT?
Yes. Open ChatGPT, go to Plugins, search Weekday Jobs, tap Try in chat and ask for data analyst jobs for freshers posted this week.